Showing posts with label getting mathy with it. Show all posts

Wednesday, February 26, 2014

defense travels

Background: During the Notre Dame game this past Saturday, the announcers were discussing UVA's sterling road record and the amount of success they've had away from the JPJA, particularly in ACC play.  By way of explanation, Doris Burke said simply, "Defense travels."  I liked it instantly (not least because that's all she said, and didn't spend three possessions blathering on trying to explain it.)

The phrase had a certain elegance, because it made perfect sense.  Hostile crowds are always yelling at you on offense, but they shush when you're on defense.  You don't have to worry about shooting backgrounds, giant swirly cutouts during free throws, false countdowns, airball chants, and all the other stuff the crowd throws at you when you have the ball.  In general, offense demands execution while defense demands effort.  (Yes, I know Tony Bennett's intricate help systems will crash and burn if you don't execute.  But still.)  It's not hard to exert effort - it is hard to be mentally sharp enough to execute.

Simply making sense wasn't quite enough, though.  I wanted to see if I could quantify the concept.  I took, out of the KenPom rankings, the top 25 teams most skewed toward offense and defense, just by dividing a team's offensive efficiency ranking (out of 351) by its defensive efficiency ranking.  The 25 teams at either end of that list are the least balanced ones.

(This method skews rather heavily toward teams at the top of either list.  I thought of taking every team with a difference of, say, 35 spots between offense and defense, but there's a huge difference between being ranked #2 and #37, and being ranked #162 and #197.  One is being really good at one thing and decent at another; one is just mediocre at everything.  Clearly, it's not actually a bad idea to cherry-pick the teams at the top, since the edges of the bell curve is where we want to do this research.)

If defense travels while offense gets stuck at home, you would expect the defense-heavy teams to be about as good on the road as at home, maybe only adjusted by the standard 3-point advantage for home teams.  Similarly, you'd figure offense-heavy teams to struggle on the road.

I decided to look only at conference games, for two reasons.  One, the vast majority of the 50 teams in the study have played an equal number of home and road games inside the conference, while including OOC games would throw that out of whack.  Two, it levels off the quality of competition.  Teams in the ACC, Big Ten, etc., would play a bunch of crappy teams at home and skew the results.  This way teams are playing competition mostly equal to themselves.

The methodology was simply to average each team's margin of victory or loss on the road and at home and then average all those together.  The result is below.  (Offense-heavy teams are on the left, defense-heavy teams on the right.)


As an example in case the numbers aren't meaning anything to you, William & Mary has lost by an average of five points on the road and won by an average of 7.14 points at home, the difference being 12.14.  The average team in the offense column wins by 1.64 points on the road and 8.3 points at home.

The obvious, and rather disappointing, conclusion is that the hypothesis is bunk.  The defensive teams actually perform ever so slightly better at home vs. on the road than the offensive teams do - the margin, however, being so close as to be functionally the same.  The correlation between road vs. home performance and defense vs. offense is essentially zero - positively no relationship whatsoever.

About all I managed to affirm with this is that defensive teams generally play somewhat closer games than do offensive teams - like, duh, they do - and that the three-point home-court advantage that linemakers give is fairly spot-on.

But the evidence is plain: it doesn't matter whether your team is defensively-oriented or offensively-oriented, you're still subject to the difficulties of playing on the road.  I was really hoping to see a correlation for a couple different reasons.  One of which is that we have a defensive team.  As it turns out, we're just special.  Only three other teams out of the 50 I looked at have an average double-digit margin of victory on the road, and all three of the others - Davidson, Harvard, and Southern - are mid-majors running roughshod over crappy conferences.  It just turns out that UVA is good on the road not because they're a defensive team, but because they're good on the road.

Thursday, January 23, 2014

acc season sim 2014

I can't believe I forgot that I did this last year, but for a short time there, I did.  Better late than never though.  This is a simulation spreadsheet of my own creation, which projects the ACC season and returns each team's likelihood of landing in a particular seed in the ACC tourney.  It's not perfect, of course, as you'll see when I run down the rules, but it's fun.  The aforementioned rules:

-- It uses KenPom's projections of how likely a team is to win a particular game.  For example, UVA has a 96% chance of winning the VT game on Saturday and a 25% chance of winning at Pitt next weekend.

-- It simulates 1,000 times.  I did 10,000 last year, but I'm sacrificing some precision to preserve some personal sanity.  (It uses Excel's random number generator, which refreshes every time you make any kind of change.  That meant that every time I wanted to update any damn thing at all, I would have to wait for it to complete literally over two million new calculations.)

-- Tiebreakers are given to the team with the higher KenPom rating, not the team that won the game between the two.  Excel has its limitations.

I won't bore you with the rest of the mechanics.  Here is the simulation as it looked on Sunday, which we'll call the outset.


And here it is after the ensuing week of play.


Probably the weirdest thing is that Pittsburgh moved to the first seed even with a loss to Syracuse.  (Not after the loss to Syracuse per se - the outset sim reflects that loss.)  Pitt, however, demolished Clemson on the road, which KenPom rewarded by moving the Panthers ahead of the Cuse in his ratings, and thus Pitt, for now, has the tiebreaker.  Also, Syracuse has a pretty rough schedule.  They're staring down future road games against all the other top four teams, all of which KenPom gives them less than a 50% chance to win.  Pitt has to play all the other top four teams too - all at home, where KenPom gives them a win probability ranging from 68% to 80%.

Some quick data from the most recent sim:

-- UVA's chance of a top-4 seed (and a double bye): 86.5%
-- UVA's chance of a top-8 seed (and a single bye): 100%
-- Currently would play the winner of the UNC (7)-Wake (10)-VT (15) seed group

I plan to update this every Thursday.  The ACC week basically runs from Saturday to Wednesday thanks to ESPN's Monday games - not ideal, in my mind, but not worth a rant either.

UPDATE!

Here is the second week of sims:


You'll see that UVA and Syracuse remain stubbornly in the 2nd and 3rd spots, respectively.  Cuse still faces that tough schedule, and math has decided they're bound to lose sooner or later.  What may surprise is Duke in the top spot, now, flipped with Pitt which has plunged to fourth.  Duke's current chances at the top seed, nearly 43%, are mildly surprising.

Duke has a nice cushy schedule left, though.  After their trip to Syracuse tomorrow, they're favored to win every game, and now that they've whipped Pitt on the road, they have nothing left away from Cameron but relative cupcakes.  This is more or less why UVA remains in such a lofty position as well.  The bottom five teams in the ACC - that is, all of them with two or fewer wins - all remain on UVA's schedule.

The obvious top four of Duke, Pitt, UVA, and Cuse, in some order, is becoming better and better established, while Clemson and FSU are staking out strong claims for at least a single bye.  And then you look at the bottom of the list, where the single highest number on the whole matrix appears.  Virginia Tech is practically guaranteed, it would seem, a basement finish.  They hurt their cause badly this week with their second loss of the season to Boston College, so the ersatz tiebreaker I use now in fact represents reality in this case (as it will in maybe 2/3 of the cases by the end of the year.) 

Data from last week, updated:

-- UVA's chance of a top-4 seed (and a double bye): 96.99%
-- UVA's chance of a top-9 seed (and a single bye): 100%
-- Currently would play the winner of the UNC (7)-Miami (10)-VT (15) seed group

I need to correct some errors from this section last week: it said BC but should've said VT (and does now); I reflexively used the second-to-last team as the 15th forgetting that, duh, there are 15 teams in this league.  That also means the 9th seed technically has a single bye.  Not that this last one changed the numbers any, but yeah, if this were a 16-team tournament, like it was in the Big East, the 9 seed would have to get past DePaul the 16th seed before playing the 8th.

Final point: thanks to the Excel tip received last week, I'm back to 10,000 sims.  I definitely prefer that level of precision, and making my processor run literally millions of calcuations only once now is highly preferable as well.

UPDATE!


Presented without commentary for now because it's late.  I'll deal with the verbiage tomorrow.

UPDATE!


So.  UVA takes a surprisingly commanding lead.  This is not a complete shock given the mostly cushy schedule.  It's still surprising.  Reflected there is the fact that UVA is KenPom-favored in all its remaining games while Cuse is the KenPom underdog in two - its road games at UVA and Duke.

Duke's inability to make up any ground on UVA hurts them, too.  They should not have made that left turn at South Bend earlier this year.  Duke is threatening to smash the previous KenPom record for offensive efficiency - how that team lost to a lousy defensive squad in Notre Dame is beyond me.  But it's a big fat anchor for their regular season title hopes.

The top four is sorting itself out into a top three plus one, which is exactly as expected following the UVA-Pitt game.  Winning that helped keep us out of where Pitt is now.  You've then got UNC and Clemson battling for 5th, which is to say, play Pitt in the tourney and not Duke, Cuse, or UVA, so that's important.  NC State and FSU fighting for 7th, Maryland and Miami for 9th (very important, as 9th is the last single bye), and GT and ND duking it out for 12th (totally pointless.)

And as usual, the biggest lock of the whole thing is VT bringing up the rear.  If they could finish 16th out of 15, they would.  All together now: awwwwwww.

The Hoos have already clinched the single bye.  They can finish no lower than 8th even by taking a big fart the rest of the season.  Better yet, by the time we speak next week, they might just have clinched the double bye; they can do this simply by winning their next two and seeing UNC lose to Duke.  It can also happen if they win only one, but the scenarios are too convoluted for me to bother looking for all of them.

At any rate, the sim offers a 99.99% chance of getting the double bye.  I can live with those odds.  The only simulated season out of 10,000 in which they didn't, they lost all the rest of their games.  If UVA got the first seed, currently and in the sim they would play the winner of FSU-Maryland, the 8/9 game.

UPDATE.


It's not terribly surprising to see UVA on top of the sim this week.  Not at all.  We already know all about Syracuse's difficult upcoming schedule, and they didn't help their cause, obviously, by losing this week.  What's surprising is the number; KenPom is basically offering a near-lock guarantee that UVA ends up with the #1 seed.

For giggles, I switched the tiebreaker - remember, I use KenPom's rank as a tiebreaker, and Cuse has fallen to 3rd in the ACC behind Duke and UVA - and gave Cuse the higher rank, and when you do that, UVA moves to about an 88-89% chance of the top seed.  So we're still looking at pretty nice odds.

One thing this can't do, because KenPom is slow to react, is account for teams on hot streaks, like, say, UNC.  Thus, UNC is stuck with astoundingly solid odds of just missing the double-bye.  Pitt does have an easier remaining schedule than the Heels - mainly due to not having to play Duke anymore - but the way the two teams are trending it's hard to buy that UNC is the one headed for the 5th seed.

Anyway, UVA.  Given that we need win just one more game to clinch no worse than the 3 seed, and the magic number with respect to Duke and the 2 seed is 2, it's no surprise that anything lower than 2 is just statistical noise.  But with catching Syracuse at home, Syracuse's difficult schedule, and the very short path left to go to remove Duke from the picture, our rooting focus should be whatever it takes to win the outright, no-tiebreakers-necessary regular season title.  The ACC doesn't count that as a championship, but we can put it on a banner anyway.

UPDATE!


Got two sims this week.  I decided to run one with a UVA loss and one with a UVA win, in the Syracuse game.

The top one, obviously, is the win.  If UVA wins, that's it.  Everyone else is fighting for #2.  No tiebreaker necessary, either.  But you knew that.  What's interesting is that the probabilities say if Syracuse loses, they likely go crashing out of 2nd and into 3rd.  KenPom calls it just about a tossup that they'll win at Florida State, while Duke's one remaining road game is at Wake and then they finish at home against UNC.  8th and 9th, which is what we're interested in with this scenario, are a fight between NC State and Maryland, although that fight is about nothing more than who gets to wear their white uniform for the game.  Wake Forest could creep into that spot, but not so likely that you'd want to bet on it.

Second one down is in case of loss.  Boo.  But thanks to that trip to Tallahassee for the Cuse, and really, one extra opportunity to trip up as well since they have two to play after this Saturday, UVA would still be a heavy favorite for the number 1 seed.

Thursday, January 31, 2013

acc season sim

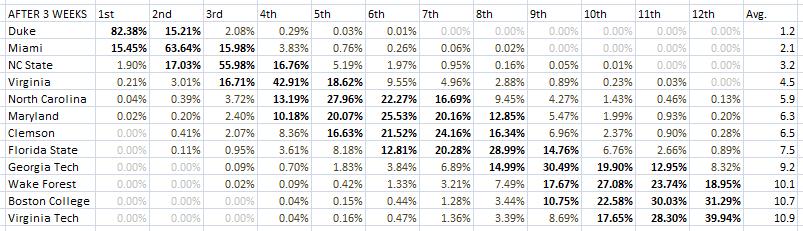
Before the ACC season got underway, I made a fancy spreadsheet toy.  Ken Pomeroy, see, projects a team's record using simple probabilities, and if you look in the right places his site also projects the conference's #1 seed and tells you what that team's chances are of getting it.  What he doesn't do is simulate 10,000 conference seasons to come up with a projected order of finish and each team's chances of landing in a particular seed from 1-12.  So I did.

There are good reasons not to, one being that doing it for 30-odd conference would be pretty time consuming.  Also, such a simulation cannot deal with tiebreakers unless you got wizard programming skills with a language of some kind.  I found a crude way to do it on the spreadsheet, but it's not the right way.  That is, it's not the conference's actual tiebreakers.

The basic idea here is that KenPom gives you a percentage chance of winning for every team in every game.  For example, at the moment he assigns UVA a 56% chance of beating Georgia Tech this Sunday and a 79% chance of beating Clemson next week.  Those change daily, but I've only bothered to update this thing weekly, that's all that's really necessary.  Anyway, these percentages are all you need.  Each game gets simulated 10,000 times and each team's wins are tallied up.  The tiebreaker, if teams end up with the same number of wins in a simulated season, is KenPom's overall team rating.  (At this point in the season, however, I've only found one instance where that tiebreaker doesn't agree with the ACC's first tiebreaker, which is head-to-head results.  And those two particular teams - Maryland and NC State - are far enough apart in KenPom's ratings that there aren't more than 10 or so of the simulated seasons where they end up actually tied.  So it's an imperfect but good enough tiebreaker for now.  As the season progresses I'll be able to switch to using the actual results to break ties, since I won't have to simulate them.)

As the season goes on, of course, I input the actual results of the games and update the sim. 

(Technical insert goes here for explanation's sake.  If you're curious, read; if this would bore you, feel free to skip and just take what I say at face value.  It's very easy to mix real results with simulated ones.  For the simulated games, the road team's chance of winning is X and the home team's is 1-X; Excel will give you a random number between 0 and 1, and if it's above X, the home team won, and if it's below, the road team won.  To insert the real results, I just change the road team's probability to 0 if they lost and 1 if they won.)

The results so far have been interesting.  Want to know what the effect was of Miami's crushing win over Duke?  Beforehand, Duke had an 82.38% chance of earning the 1 seed and Miami a 15.45% chance.  The roles are reversed; Miami is now at 62.77% and Duke crashed to 36.26%.  And to warm the cockles of your heart, VT has gone from a 16.07% chance of earning the basement 12th seed to a nearly 55% chance after last weekend.

Here are each week's results so far.  Click on each to make them bigger if they interest you; skip ahead to see UVA's numbers alone.


For UVA specifically:

Outset:
1st: 2.07%
2nd: 33.69%
3rd: 25.23%
4th: 16.39%
5th: 10.35%
6th: 6.13%
7th: 3.30%
8th: 1.91%
9th: 0.76%
10th: 0.14%
11th: 0.02%
12th: 0.01%
Projected seed: 2nd

After 1 week:
1st: 3.37%
2nd: 29.41%
3rd: 33.98%
4th: 17.79%
5th: 8.42%
6th: 3.89%
7th: 1.91%
8th: 0.77%
9th: 0.42%
10th: 0.04%
11th: 0%
12th: 0%
Projected seed: 3rd

After 2 weeks:
1st: 0.05%
2nd: 1.22%
3rd: 7.22%
4th: 28.67%
5th: 22.98%
6th: 16.15%
7th: 11.22%
8th: 7.53%
9th: 3.18%
10th: 1.35%
11th: 0.34%
12th: 0.09%
Projected seed: 4th

After 3 weeks:
1st: 0.21%
2nd: 3.01%
3rd: 16.71%
4th: 42.91%
5th: 18.62%
6th: 9.55%
7th: 4.96%
8th: 2.88%
9th: 0.89%
10th: 0.23%
11th: 0.03%
12th: 0%
Projected seed: 4th

After 4 weeks:
1st: 0.57%
2nd: 4.36%
3rd: 46.41%
4th: 28.37%
5th: 11.80%
6th: 5.35%
7th: 2.09%
8th: 0.78%
9th: 0.21%
10th: 0.06%
11th: 0%
12th: 0%
Projected seed: 3rd

The kicker here is that these results are only through Monday, which is when I've been updating these because the ACC doesn't play games on Mondays.  Meaning it doesn't yet account for our glorious triumph over the Wolfpack this week.  Have to wait til Monday; that, boys and girls, is the cliffhanger.

Thursday, February 2, 2012

tempo-free lacrosse

If you're a lacrosse fan, or a math fan, or a lacrosse fan who likes math, then here is your post.  This is my attempt at mathifying the game.  Inspired by Ken Pomeroy's well-known basketball ratings, and a similar tempo-free approach to the game of lacrosse espoused by Great Lax State (a blog about lacrosse in the great state of Michigan), I decided to make an attempt at breaking down college lacrosse in a Pomeroyesque fashion.  Let me give you the numbers first so you know what we're building to; the explanation follows.  These are from last season.


Lacrosse, like basketball, is at its heart a game of possessions and how well you make use of them.  For our purposes here, there is one major difference: in basketball, possessions alternate without exceptions.  For every possession by the good guys, there is always a corresponding possession for the bad guys, excepting that you win the opening tip and then have the ball at the end.  But it's still a 1-for-1 deal.

In lacrosse, it's 1-for-1 except that scoring and game periods result in a faceoff, not an automatic trade of possession.  In basketball, you can count possessions with stats from the boxscore; in lacrosse, I believe we can do the same.  A team can begin a possession one of three ways:

- Win a faceoff.
- Gain the ball on the defensive end.
- Gain the ball on the offensive end.

The boxscore gives us faceoff numbers, of course.  How do you gain the ball in your offensive end?  A successful ride - that is, a failed clear by the opponent.  Also in the boxscore.  How do you gain the ball in your defensive end?  Any number of ways, but they are counted in the boxscore as either clears or failed clears.  Thus we have three ways to mark a lacrosse possession, all of which are in a standard boxscore:

- A faceoff win.
- A clearing attempt.
- A failed clear by the opponent.

So a team's total possessions in a game can be determined by adding faceoff wins, clearing attempts, and failed clears by the opponent.  Note that we leave ground balls out of it, because ground balls tell us nothing about who lost it in the first place, or where.  If you win a ground ball in your defensive end and successfully clear it, that'll show up in the boxscore.  If you win a ground ball in your offensive end, but you lost the ball to begin with, then we don't count that as a change of possession.  Possession is lost only when the other team clears (or fails to, but they had the ball and the chance to) or at the next faceoff, whether that faceoff was the result of a goal or a new quarter.

Another important difference between lacrosse and basketball is that here, we're marking the beginning of a possession.  The way KenPom does it in basketball is to mark the end.  For lacrosse, this is a more accurate way to do it.

In totaling up last year's stats, it turns out that almost exactly one-third of possessions start on a faceoff.  Tangent: this is why I will, from here on out, bang the drum that faceoff percentage is overrated.  A typical game is about 70 possessions.  (Let's say 69 for divisibility purposes.)  This game would have 23 faceoffs.  If you win 56% - an excellent number - that's 13 of 23, and since all other possessions are one-for-one by definition (that is, after a faceoff, teams will trade clears until someone scores or the period ends) you get half of the remaining 46 and 13 of the faceoff 23, for 36.  The other team gets 33.  Your prowess at the faceoff X gave you just 52% of the possessions.  While that can swing the tide in a close game, it's not the end-all, be-all that it's often portrayed as.  People freak out about losing too many faceoffs, and it seems logical to do so, but much more important is your clearing game, offense, defense, etc.  Does it matter?  Absolutely it matters.  But only when faceoff percentage gets really large - over 60% or so - does it start to have a major, freakoutable impact.

OK, anyway.  Faceoffs are one-third of possessions, and the rest are one-for-one.  This is where that difference from basketball comes to get us, because we can't split the possessions evenly; we have to weight them.  The final numbers above show how many goals a team would score and give up in a 100-possession game; how do we get there from here?  If Team A is expected to score 16 goals in a 100-possession game, where do I get that number?

-- First, we determine how many of those 100 possessions belong to Team A.  That's easy.  33 possessions are allocated to faceoffs and 67 are split evenly between Team A and their opponent, Team B.  Team A gets 33.5 possessions plus their faceoff percentage times 33.  The equation:

33.5 + (FO% * 33)

-- Next, we need to know how many of those possessions made it to the offensive side of the field.  You can't score if you don't get into the box.  (OK, you can, but we're ignoring acts of God here.)  Faceoff wins are assumed to always make it to the offensive side, because the boxscores don't differentiate.

Last season's data shows that of the 67 non-faceoff possessions, 57 start on the defensive end and 10 are the result of a ride.  Therefore we give Team A five offensive zone possessions and add them to the possessions given them by faceoffs.  Then we look at their clearing percentage.  Multiply their clearing percentage by 28.5 (half of 57) and add the result to the above.  The resulting equation is:

(FO% * 33) + (CL% * 28.5) + 5

Now in our fictitious 100-possession game, we know how many times Team A had the ball in the offensive zone.  In real life, we know how many goals Team A scored (obviously) and we also know how many actual offensive possessions they had, because we can add up their clears, rides, and faceoff wins.  Simply dividing goals by offensive possessions gives you a percentage, which, multiplied by the offensive possessions per 100 we just came up with, gives you the team's final O-rating.

And you can repeat the whole process for defense as well.  Essentially the D-rating is each team's opponents' O-rating, as if the combined opponents' stats were for one team.

There's your explanation.  Let me now try and pre-emptively fend off a few questions:

Why does it say "raw" O-rating (and D-rating) on the header?

Because I don't have a good way of adjusting for strength of schedule.  Yet.  I do have one way, but it's crude and not fit for public consumption and not even useful til at least three-quarters of the season is over - although it does at least do a better job of putting the best teams at the top.

Why not simply rank the teams by goal percentage and goals-allowed percentage, instead of all that rigamarole about possessions?

That does have its appeal.  But it doesn't tell the whole story.  By rolling up faceoff percentage and clearing percentage into the statistic, you get a better sense of how dangerous a team really is.  Take Yale, a team that was very close to making the tournament last year.  They had a very pedestrian, middle-of-the-road goal percentage - 28th.  Their phenomenal faceoff percentage makes them much more dangerous than the Marists of the world, though, and they are 13th in this O-rating calculation.  Likewise, a very good defensive goals percentage plus that faceoff prowess makes them tough to score on.

What if a team is credited with a clear directly after winning a faceoff?  That would skew their possession numbers.

Smarter lax fans than I will have to speak up and say how often that happens, if at all.  I don't know.  If it doesn't, great; if it does, oh well, the boxscore doesn't make a distinction, and so I have to work with what I got.  I thought about that early on but realized, either way, I can't do anything about it.  So I stopped giving it any thought.

But if a team's riding ability is really good, shouldn't that give them an offensive advantage, and vice versa if it's poor?  Instead of just handing out the same number to everyone to "account" for the ride?

Kind of.  I would indeed like to refine this thing a little more to include that.  For the sake of accuracy and accountability and waterproofing the formula and all that.  But as a rough go, it's pretty close; successful rides aren't all that common to mess with the numbers too much.  And the truth is that unless a team really presses (which rarely happens outside of endgame situations when a team is trying to come back) whether or not the ball is cleared has a lot more to do with the clearing team.

Are you going to update this during the season?

No.  If you haven't noticed, I'm a damn superstar at promising I will continuously update something and then not doing it.  I will do it on my own during the season, use the numbers in previews and analysis and such, and share them at the end of the year, and upon request.

Can't you make this damn thing sortable?

No.  I just write.  I took one programming class in college and it was the biggest mistake I ever made in those four years.  Someone wanna help me out in that department, be my guest.

I have more questions!

Then ask them.  Nothing like a little scrutiny to help make these things better.

Wednesday, May 11, 2011

next year in the acc

By which I mean basketball.  Now that the myriad deadlines have passed relating to the NBA draft and we know definitively who's in and who's out, it's possible to have a look at how next year's teams will stack up against each other.  Besides the graduating seniors, five ACC underclassmen also declared for the draft: Reggie Jackson (BC), Kyrie Irving (Duke), Chris Singleton (FSU), Iman Shumpert (GT), and Jordan Williams (Md.)

This post uses the PORPAG stat as derived by some sharp Michigan State folks and the somewhat less scientifically rigorous EPORPAG stat (but I like it anyway) that I derived myself (that's why.)  As a refresher, the formulas are:

(O-rating - 88) * Poss.% * Min% * 0.65 = PORPAG

PORPAG * ( ( (Blk% / 2) + Stl%) / 2.45 ) = EPORPAG

88 and 2.45 are replacement-player constants; 0.65 is a pace factor for the ACC.  The result of each is a number that approximates how many more points per game a particular player is worth to his team than a replacement-level schmo.  PORPAG is offense-only and EPORPAG makes some attempt at including defense in the equation.  For explanations of why all this is so, click the links above.

Also, I only ever calculated these for players who played over 30% of their team's minutes on the season.  Anything less was going to end up with a bunch of small numbers that'd be basically the same whether the player is Michael Jordan or you.

So anyway.  Team by team, here's who lost what and what's left for next year:

BOSTON COLLEGE

We all knew they were gonna be slammed by graduation.  They lost four excellent seniors and the conference's top offensive player, Reggie Jackson.  Jackson's PORPAG was 4.80 on the season, the best in the ACC.  (The reason BC wasn't totally awesome was because he and Joe Trapani were the only two players on the team whose EPORPAGs were higher than their PORPAGs, which is supposed to happen.  In other words, basically the whole team played worse than replacement-level defense.)  Next year, BC will carry over five players.  Five.  One freshman starter, two bench bodies at the back of the rotation, one transfer, and one walk-on.  They'll add six new freshman, but, look, if this team is anywhere near .500 in the conference their coach should be made King of Massachusetts.

CLEMSON

EPORPAG's favorite player in the ACC was a surprise: Clemson's Jerai Grant, who was a perfectly good scorer on the offensive end and did a lot of work on defense to give him an EPORPAG of 8.02.  Next-best was GT's Shumpert at 5.84.  Fortunately for the rest of us, Grant's gone.  Clemson is one of five ACC teams to lose only two players, but as far as EPORPAG goes, they're the only one of those five to lose their top two guys.  (And of the two more ACC teams that only lose one, neither is their best.)  Clemson has some good building blocks remaining and is certainly in better shape than BC, but it's gonna be kind of a transition year.

DUKE

Aw, you know how it is.  They're the Yankees.  They lost Irving, as well as Nolan Smith and Kyle Singler (but Singler isn't even that amazing a defender) but they just picked whatever talent they wanted for their freshman class so it doesn't matter. 

FLORIDA STATE

The reason I like EPORPAG is that I think it passes the eye test for the most part, and one of the eye-test players is FSU's Singleton.  His EPORPAG is well over twice his offense-only PORPAG, which is about what people think of his game.  Even with him gone, FSU will have a great defense, and I'll tell you right now, Bernard James will take center stage next year and open a lot of eyes.  James is the best returning player in the league in EPORPAG because he's an outstanding shot-blocker and gets steals at the rate of a guard.  He got some press this past year for his background as an Air Force NCO, but he'll get legitimate coverage for his basketball skills this season.

GEORGIA TECH

This team was crap last year because they had Iman Shumpert, Glen Rice, and a lot of basically replacement-level dudes.  Shumpert is gone and now it's Rice and the Replacement-Levels.  They're very young, though, so there's a lot of room for growth.  The only scholarship junior was Shumpert.  Lot of uncertainty here, with the mostly-undeveloped team and new coach.

MARYLAND

Uncertainty here, too, but the bad kind.  With three seniors plus Jordan Williams leaving, the roster is very light on returning contributors.  Maryland's second-best 2011 recruit, Sterling Gibbs, has asked for his release, making it absolutely imperative they hang on to Nick Faust, their best.  There will be some lesser-used guys playing bigger roles, and we'll find out if Terrell Stoglin is capable of carrying the team as the focal point.  None of the upperclassmen are anything but role players, so their large sophomore class will have to take charge.

MIAMI

Could be a scary team.  They lose just one contributor, and they have the highest returning combined PORPAG and EPORPAG in the league.  Yes, higher than Duke and UNC.  I don't think they'll be better than those two, but honestly if they can't get to the tournament with that bunch, then their coaching hire is a failure.  We've seen what Jim Larranaga can do, so I doubt very much that'll be the case.

NORTH CAROLINA

These guys were by far the biggest beneficiaries of draft decisions.  They only lost little-used senior Justin Knox to graduation; Tyler Zeller and Harrison Barnes defied conventional logic and returned to school.  Those two were easily the team's PORPAG leaders last year.  Not that there isn't talent behind them (naturally, UNC has two five-star freshmen coming in) but those two decisions mean UNC will legitimately be considered a contender instead of just because they're UNC.

NC STATE

The Wolfies return more 30%-of-minutes players than anyone else with seven, and all but one was a freshman or sophomore.  Or they did until Ryan Harrow asked for a transfer.  Despite crappy results in the win column last year, NC State's guys put up quality tempo-free numbers for their ages.  (Key is "for their ages" - they didn't have any big numbers, just a lot of decent ones.)  Still, with a much better coach on the sidelines they should see plenty of improvement, and if they can get over the loss of point guard Harrow, there should be a good core to rebuild around.

VIRGINIA

Well, you know how it is.  Actually, if you go by just PORPAG and whatnot, this team overachieved amazingly last season.  The best offensive player was Joe Harris at a PORPAG of 1.59; Mu Farrakhan was just a shade less at 1.58.  Those are above-average but pretty pedestrian numbers; NC State's "decent for their ages" guys were led by Scott Wood at 2.26.  But Harris was the fourth-best freshman in the league last year, or at least had the fourth-highest PORPAG, and KT Harrell was eighth, making UVA just one of three teams with two of the top ten freshmen.  Mike Scott, of course, is the wild card.  Had he played the whole season at the minutes pace he started on, he'd have had a PORPAG of 3.42 - good enough to be the best returning player in the league.

VIRGINIA TECH

It's awfully hard to tell what this team should look like because Seth Greenberg doesn't seem to know you can freely substitute in and out, unlike, say, soccer.  Three pretty huge contributors depart, and only Erick Green and Victor Davila remain among players that Greenberg actually used.  They'll get a couple quality players back from injury and add a decent freshman class to the equation, so as with UVA, the Hokies will probably outperform the PORPAG tally I'm about to do.

WAKE FOREST

God this team was bad.  I can't remember any time since I became a UVA fan that an ACC team that we called bad was actually, legitimately shitty and unable to beat even other bad opponents, as opposed to merely not really good enough to win the conference.  (That makes it even more awesomer that we lost to them!)  Will they be better?  Yes.  Competitive?  Probably not.

******************************************************

That was the summary; here's the tally I mentioned.  These two lists rank the ACC teams by the total PORPAG and EPORPAG of their returning players:

PORPAG (offense only):

Miami: 10.00
UNC: 9.83
Duke: 7.43
NCSt: 7.29
Clem: 5.13
UVA: 3.43
FSU: 3.08
WF: 2.98
Md: 2.88
VT: 2.83
GT: 2.08
BC: 0.82

EPORPAG

UNC: 12.76
Miami: 11.10
Duke: 10.76
NCSt: 8.78
FSU: 7.53
Clem: 5.99
VT: 4.08
UVA: 3.90
WF: 3.43
Md: 2.91
GT: 2.71
BC: 0.63

This is a reasonably accurate picture of how things will look.  For common sense reasons, the actual predicted order should look a little different.  UVA, VT, and mayyybe GT will outperform those rankings; NC State and Wake will probably underperform them, and so will Miami just because they won't really be the conference's best or second-best team.  But I'll be keeping these lists in mind when it comes time to prognosticate the 2011-12 hoops season.

Thursday, February 17, 2011

basketball mathitude

One of the neat things about basketball is that, after baseball, it's the sport that best lends itself to cold, hard statistical breakdowns and the creation of fancy sabermetric stats - in hoops, they're called "APBRmetrics," which hasn't caught on like "sabermetrics" because it needs either more vowels or friendlier consonants to be reasonably pronouncable.

One stat that I like actually comes to you not from the usual suspects like Ken Pomeroy, but from Michigan State blog The Only Colors. (Technically they didn't come up with it, someone else did that lets TOC use it, but I saw it at TOC first and you can follow the credit chain all the way back to the beginning if you like.) They call it PORPAG: Points Over Replacement Per Adjusted Game. Follow the links all the way back for the full explanation; here's the summary (you may already know this stuff if you're a hoops math geek, or maybe not):

- It's like baseball's VORP; it tabulates how many points a player is worth over a "replacement" player - not "average", but "replacement", which is actually below average. Replacement = a guy you can get just about anywhere.

- The equation is thus: (Off.Rtg - 88) * Min% * Poss% * Pace

The stats can be found at KenPom or at StatSheet. Offensive rating is a creation of way smarter people than you or I that tells you how many points a player produces per 100 possessions. 88, because that's what they decided was replacement level. "Min%" is the percentage of available minutes in the season (40 * games) that a player has played. "Poss%" is the percentage of possessions a player ends while on the floor - ends, by either taking a shot or turning the ball over. "Pace", if you followed the links, is .62 because the average Big Ten game has 62 possessions. I used .65, because the ACC moves a little faster.

- The reasoning is that offensive rating is points per 100 possessions, so taking into account only the possessions actually used by the player (poss%), the minutes he's actually on the court (min%), and the number of possessions in a game, you get an approximation of how many points the player is worth per game, over someone you could just pull off the street (well, the recruiting trail, anyway) with no effort. Simple.

- The stat does nothing for defense, nor does it account for the interaction between players, chemistry on the court, etc.

Using .65 for the pace factor, and keeping the replacement-level 88 the same, here are the PORPAGs for all ACC players with over 30% of minutes played, except for those who sustained season-ending injuries early in the year (Mike Scott, Dorenzo Hudson.)


To save you a click, the top 10 are:

Reggie Jackson (BC)
Nolan Smith (Duke)
Malcolm Delaney (VT)
Kyle Singler (Duke)
Malcolm Grant (Miami)
Corey Raji (BC)
Reggie Johnson (Miami)
Jerai Grant (Clemson)
Jordan Williams (Maryland)
Tyler Zeller (UNC)

And UVA's guys:

#21- Mustapha Farrakhan - 2.05
#33 - Joe Harris - 1.59
#39 - KT Harrell - 1.24
#63 - Sammy Zeglinski - 0.53
#68 - Will Sherrill - 0.44
#86 - Assane Sene - 0.07
#87 - Jontel Evans - 0.04
#88 - Akil Mitchell - -0.01

So you see why we lose so much.

The point originally was to apply something useful someone else had done to the ACC. But I wasn't quite satisfied. Must be a way, I figured, to bring defense into the equation somehow, but nobody's ever come up with a defensive rating for individual players. I racked my brain, fiddled with numbers, and came up with this:

PORPAG * ( ( (Block% /2) + Steal %) / 2.45)

That's a lot of parentheses. Here's the thinking:

- Blocks and steals are the player's way of taking points off the board for the other team.

- The average team offensive rating is about 101, so essentially, teams average a point per possession. Possessions are, most of the time, either two or zero points, though. One point is about as common as three. So when you come up with a steal, you took two points off the board. A block would also be two, but roughly half the time the offensive team ends up with the ball again and the possession doesn't end. So I went with the assumption that a block takes one point off the board.

- One problem with defense is that certain stats (rebounds, blocks) lend themselves toward big men; and steals, toward guards. I left off rebounds because they generally have nothing to do with who caused the miss. This, plus the dividing of blocks in two, keeps big men from dominating the stat.

- Block percentage and steal percentage are explained here. I'm not gonna get deep into them, but suffice it to say they're basically the percentage of possessions which a player is on the floor for that he comes up with a block or a steal, respectively.

- "Replacement level" is 2.45. I came up with this by:

- Starting with the national average team block and steal percentage (9.2 and 9.5, respectively.)
- Dividing each by 5, because there are five players on a court (1.84, 1.9.)
- Multiplying again by .87, because that is 88/101 - the replacement level offensive rating divided by the average (1.6, 1.65.)
- Dividing the block percentage by 2, because of the reasons stated above (0.8, 1.65.)
- Add together for 2.45.

Divide a player's (block% + steal%) by 2.45 and you get a multiplier to apply to his PORPAG. This approximates adding his defensive contributions to his offensive ones. This is, for lack of a better phrase, enhanced PORPAG. EPORPAG. Acronyms should probably not have three syllables in them, but screw it. The new chart:


I'm as surprised as you are about the top player, but consider: Grant blocks 10% of opponent's shots that occur while he's on the floor. That's a crazy number. And that's a big steal percentage for a shot-blocker. Is he worth 9, almost 10 extra points to his team? Yeah, maybe.

Despite the presence of a lesser-known (and heretofore referred to as "wicked underrated") player on the top of the chart, I think this passes the sanity test. Look at Chris Singleton, considered one of the top players in the league. DPOY. He goes, from a middling nobody under PORPAG (less valuable than Mu Farrakhan) to one of the league's top players again under EPORPAG. Offensive dynamos - the guys that get the headlines - still get their due credit. Jackson and Smith are still way up there. Delaney, not as much, because he's not too far above average on defense. Iman Shumpert gets his due for being a steals fiend.

The problem is that it's kinda fishy the closer you get to zero PORPAG. A guy like Assane Sene, who blocks a zillion shots, still doesn't quite get his due for it because he's a stiff on offense. Theoretically, a guy could be exactly replacement-level on offense and block 100% of shots on defense and he'd still be replacement-level. And this still says nothing about on-court chemistry, and good off-ball defenders still don't get their due because their guys don't get the ball. Like a cornerback that quarterbacks never throw at. (But this is a stats-based thing, and there will never be a stat for good off-ball defending.)

So there are still limitations, just as there were with the original. But this is why coaches run the show and not statisticians. I think in general, the limitations with this as a new stat are limitations with statistics themselves, and not this one in particular, which is as good as I can hope for. And I think ultimately, I've taken a good thing and made it better.

Wednesday, October 20, 2010

projecting the future

Ever do a metric butt-ton of work for a really simple conclusion? Then you'll love blogging. Today, since this week represents the halfway point of the season, we attempt to project the second half. It'd have taken about 15 minutes if I just whipped out the ol' rectal extraction tables - 5 minutes with the calculator and 10 typing the post - but I thought I'd get all scientific and use the Sagarin ratings instead.

Here's the way-too-complex methodology: Sagarin, see, assigns a rating to each team. These can be used to predict the outcomes of any game; you take the rating of the two teams, add 3.5 to the home team's rating, subtract the lesser number from the greater, and you get the point spread. UVA's rating is 64.69, Eastern Michigan's is 49.73, give UVA an extra 3.5 for being the home team, and UVA is favored, according to Sagarin, by about 18.5 points.

What that doesn't do is give you a percentage chance of winning, which is what I was really after. So I decided to make it hard on myself. I calculated the projected margin of victory (PMOV) for each of UVA's remaining games:

UVA over EMU by 18.46
Miami over UVA by 13.08
UVA over Duke by 4.61
Maryland over UVA by 1.25
Boston College over UVA by 3.46
Virginia Tech over UVA by 19.06

And then I compared those to every game played this season and their PMOVs, +/- 1 for the three smaller PMOVs and +/- 2 for the three larger so as to have a better sample size.** For example, 64 of this season's games had a PMOV between 3.61 and 5.61, the search margin for the Duke game. 49 of those ended in victory for the chalk and 15 of them ended in an upset. So I consider the Duke game to be a 77% chance of victory for UVA.***

Using that methodology, here are our chances of winning the next six games on the schedule:

Eastern Michigan: 100%
Miami: 3%
Duke: 77%
Maryland: 37%
Boston College: 22%
Virginia Tech: 0%

Nobody so far this season has pulled off an upset, when facing an 18-point PMOV. So for all intents and purposes (hey! grammar lesson: it's not "for all intensive purposes", so if I catch any of you people saying it like that I will slap you with a fish) it would take a miracle to beat VT or lose to EMU. I let the 100%s stand in the next step.

Which you ought to be familiar with: there are 16 possible outcomes from the four up-in-the-air games, and here they are:

Win all four: 0.19%

Win three, lose to BC: 0.67%
Win three, lose to Md.: 0.32%
Win three, lose to Duke: 0.06% (the least likely of all outcomes)
Win three, lose to Miami: 6.08%

Beat Miami/Duke, lose to Md./BC: 1.14%
Beat Miami/BC, lose to Duke/Md.: 0.10%
Beat Md./BC, lose to Miami/Duke: 1.82%
Beat Miami/Md., lose to Duke/BC: 0.20%
Beat Duke/BC, lose to Miami/Md.: 10.35%
Beat Duke/Md., lose to Miami/BC: 21.56%

Lose three, beat BC: 3.09%
Lose three, beat Md.: 6.44%
Lose three, beat Duke: 36.70% (the most likely of all outcomes)
Lose three, beat Miami: 0.34%

Lose all four: 10.96%

Add them all up and you get the following percentages (these include the so-called guaranteed win and loss against EMU and VT):

Chances of finishing 3-9: 10.96%
Chances of finishing 4-8: 46.57%
Chances of finishing 5-7: 35.15%
Chances of finishing 6-6: 7.12%
Chances of finishing 7-5: 0.19%

The standard caveats of rounding and adding up to 100 apply.

So there you have it: the projected finish at this point is 4-8, with a very decent chance of getting to 5-7.

Of course, if the BC game was at home it'd be a totally different story: they are ranked only 0.04 points below us, meaning that home-field advantage is the entire difference. And BC crowds have been known to be notoriously small; there probably won't be 3.5 points worth of difference at Chestnut Hill. Just one of many, many ways real life interferes with the cold, unfeeling mosaic of numbers. So take it for what it's worth to you.

**Yes, every bloody damn game. I have a special talent for deciding to do things that I think will take X time, and finding they really take X+N time, where N is a number somewhat north of twice X.

***I'm aware of the circular nature of this: these games are the sole determining factor in these ratings, so I'm applying the ratings to their own component parts. But the results were sufficiently bell-curvy, in that there were fewer upsets the greater the PMOV, so I went with it.