
There are good reasons not to, one being that doing it for 30-odd conference would be pretty time consuming. Also, such a simulation cannot deal with tiebreakers unless you got wizard programming skills with a language of some kind. I found a crude way to do it on the spreadsheet, but it's not the right way. That is, it's not the conference's actual tiebreakers.
The basic idea here is that KenPom gives you a percentage chance of winning for every team in every game. For example, at the moment he assigns UVA a 56% chance of beating Georgia Tech this Sunday and a 79% chance of beating Clemson next week. Those change daily, but I've only bothered to update this thing weekly, that's all that's really necessary. Anyway, these percentages are all you need. Each game gets simulated 10,000 times and each team's wins are tallied up. The tiebreaker, if teams end up with the same number of wins in a simulated season, is KenPom's overall team rating. (At this point in the season, however, I've only found one instance where that tiebreaker doesn't agree with the ACC's first tiebreaker, which is head-to-head results. And those two particular teams - Maryland and NC State - are far enough apart in KenPom's ratings that there aren't more than 10 or so of the simulated seasons where they end up actually tied. So it's an imperfect but good enough tiebreaker for now. As the season progresses I'll be able to switch to using the actual results to break ties, since I won't have to simulate them.)
As the season goes on, of course, I input the actual results of the games and update the sim.
(Technical insert goes here for explanation's sake. If you're curious, read; if this would bore you, feel free to skip and just take what I say at face value. It's very easy to mix real results with simulated ones. For the simulated games, the road team's chance of winning is X and the home team's is 1-X; Excel will give you a random number between 0 and 1, and if it's above X, the home team won, and if it's below, the road team won. To insert the real results, I just change the road team's probability to 0 if they lost and 1 if they won.)
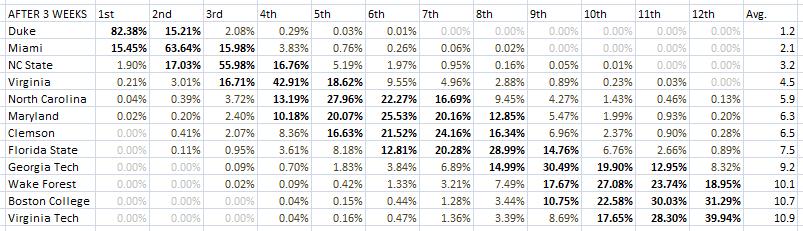
The results so far have been interesting. Want to know what the effect was of Miami's crushing win over Duke? Beforehand, Duke had an 82.38% chance of earning the 1 seed and Miami a 15.45% chance. The roles are reversed; Miami is now at 62.77% and Duke crashed to 36.26%. And to warm the cockles of your heart, VT has gone from a 16.07% chance of earning the basement 12th seed to a nearly 55% chance after last weekend.
Here are each week's results so far. Click on each to make them bigger if they interest you; skip ahead to see UVA's numbers alone.


For UVA specifically:
Outset:
1st: 2.07%
2nd: 33.69%
3rd: 25.23%
4th: 16.39%
5th: 10.35%
6th: 6.13%
7th: 3.30%
8th: 1.91%
9th: 0.76%
10th: 0.14%
11th: 0.02%
12th: 0.01%
Projected seed: 2nd
After 1 week:
1st: 3.37%
2nd: 29.41%
3rd: 33.98%
4th: 17.79%
5th: 8.42%
6th: 3.89%
7th: 1.91%
8th: 0.77%
9th: 0.42%
10th: 0.04%
11th: 0%
12th: 0%
Projected seed: 3rd
After 2 weeks:
1st: 0.05%
2nd: 1.22%
3rd: 7.22%
4th: 28.67%
5th: 22.98%
6th: 16.15%
7th: 11.22%
8th: 7.53%
9th: 3.18%
10th: 1.35%
11th: 0.34%
12th: 0.09%
Projected seed: 4th
After 3 weeks:
1st: 0.21%
2nd: 3.01%
3rd: 16.71%
4th: 42.91%
5th: 18.62%
6th: 9.55%
7th: 4.96%
8th: 2.88%
9th: 0.89%
10th: 0.23%
11th: 0.03%
12th: 0%
Projected seed: 4th
After 4 weeks:
1st: 0.57%
2nd: 4.36%
3rd: 46.41%
4th: 28.37%
5th: 11.80%
6th: 5.35%
7th: 2.09%
8th: 0.78%
9th: 0.21%
10th: 0.06%
11th: 0%
12th: 0%
Projected seed: 3rd
The kicker here is that these results are only through Monday, which is when I've been updating these because the ACC doesn't play games on Mondays. Meaning it doesn't yet account for our glorious triumph over the Wolfpack this week. Have to wait til Monday; that, boys and girls, is the cliffhanger.

4 comments:
Watching this team this year has been a lot of fun. There have been several year recently where we got our fifteenth win late in February. The season started a little early this year, but whatever. There were people on another UVa website moaning about Jesperson and why he plays so much. Mind boggling. Virginia fans much they must be the number two whiny fanbase in sports, behind Red Sox fans of course.
This is awesome! Thanks for doing it and sharing it.
Interesting view, thanks for taking the time to put that together
@pezhoo - as a sox fan and a uva fan, i can confirm that both sets of fans are extremely whiny and always assume the worst.
@brendan - could you add a column that includes each team's record so it's easier to figure out who each team had just played to change the percentages? it'd be much easier than having to try to track down what the conference record was for a particular week, etc. just a suggestion!
Post a Comment